M/S Spectrum Analyzer
One analyzer, two personalities. Flip between a 31-band LED rack that reads like hardware and a high-resolution FFT that draws MID and SIDE as separate traces, so you see what sits in the centre and what lives in the width. Hold the mouse on any peak and it tells you the frequency and the note. The audio passes through untouched, at zero latency.
VINAIspectro reads your signal and passes it through completely untouched. No filtering, no coloration, no added latency. Leave it on the master through bounce; the render is bit-identical with it in or out.
We ship numbers, measured to the floor of the instrument itself.
0 ms latency · bit-transparent pass-through · 8192-point analysis · M/S exact by construction

Thirty-one third-octave bands, drawn as a real LED ladder: rounded segments with a lens highlight, a tip that burns brighter at the current level, and a soft phosphor bed behind every active column. Each band integrates the full energy of its slice, not a single bin, so the ladder moves the way the mix actually breathes. PERSIST leaves a specular peak-hold segment floating above each column.
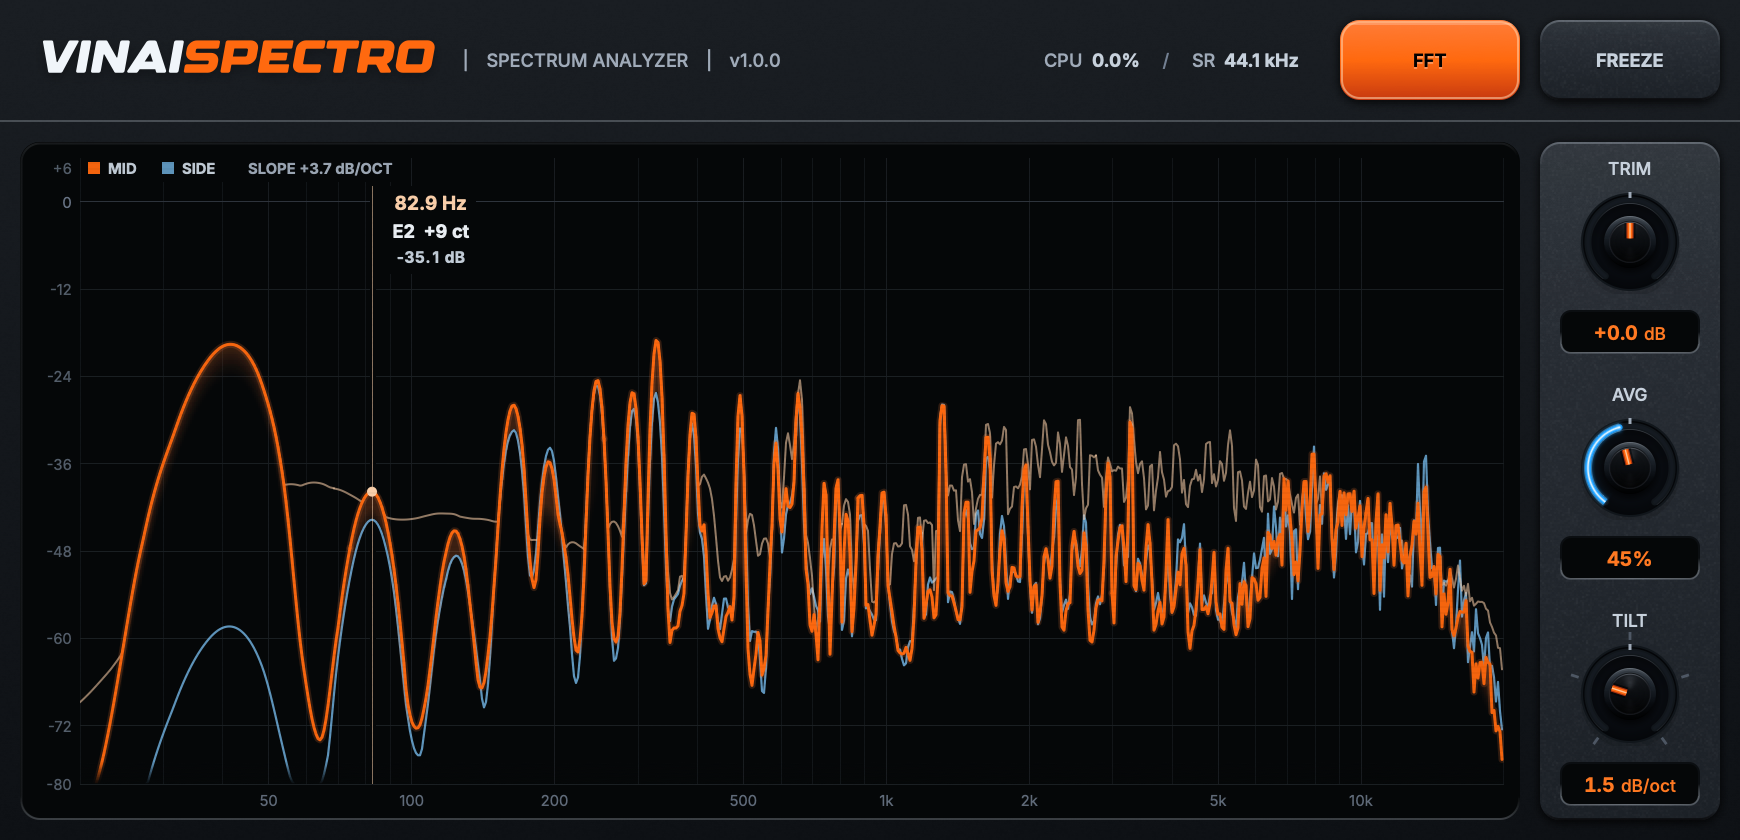
The FFT view splits your stereo image into its true components: the MID trace in lava shows what sits in the centre of the mix, the SIDE trace in blue shows what lives in the width. Mono content leaves the SIDE line flat at the floor by construction, so what you see is what phase actually does. An 8192-point analysis with smooth fractional-bin drawing keeps the curve clean at every zoom, with no stair-steps in the lows.
VINAIspectro shows the spectrum the way a producer thinks about it: the balance, the width, the note that peak is sitting on. No menus, no math, just the read.
The classic hardware ladder: band energy at a glance, peak-hold memory per band.
Centre and width as separate traces. See exactly what stereo processing is doing.
Hold the mouse on a peak: frequency, musical note with cents, and level.
Press and hold anywhere in the FFT view and a crosshair locks to the spectrum: the readout shows the exact frequency, the musical note with its cents offset, and the level under the cursor. That resonance in the low mids stops being "around 200 Hz" and becomes A3, minus 12 cents. Tune your kick to the sub, find the ringing bin, then let go and it is gone.
| Type | Spectrum analyzer, dual view |
| Views | RACK: 31-band 1/3-octave LED ladder · FFT: log-frequency curves, MID + SIDE |
| Analysis | 8192-point FFT · Blackman-Harris window · hop-anchored, shimmer-free · matched display slopes across views |
| Range | 20 Hz to 20 kHz · +6 to −60 dB, same rail in both views |
| Cursor | Press-and-hold: frequency · musical note with cents · true dB level |
| Trim | ±12 dB display offset (display only, no audio change) |
| Avg | Analyzer release, 60 ms to 2.4 s |
| Persistence | Peak-hold amount and decay |
| Latency | Zero: 0 ms / 0 samples |
| Formats | VST3 · AU |
| Systems | macOS 11+ (Universal) · Windows 10+ · 64-bit |
| Version | 0.1.0 |

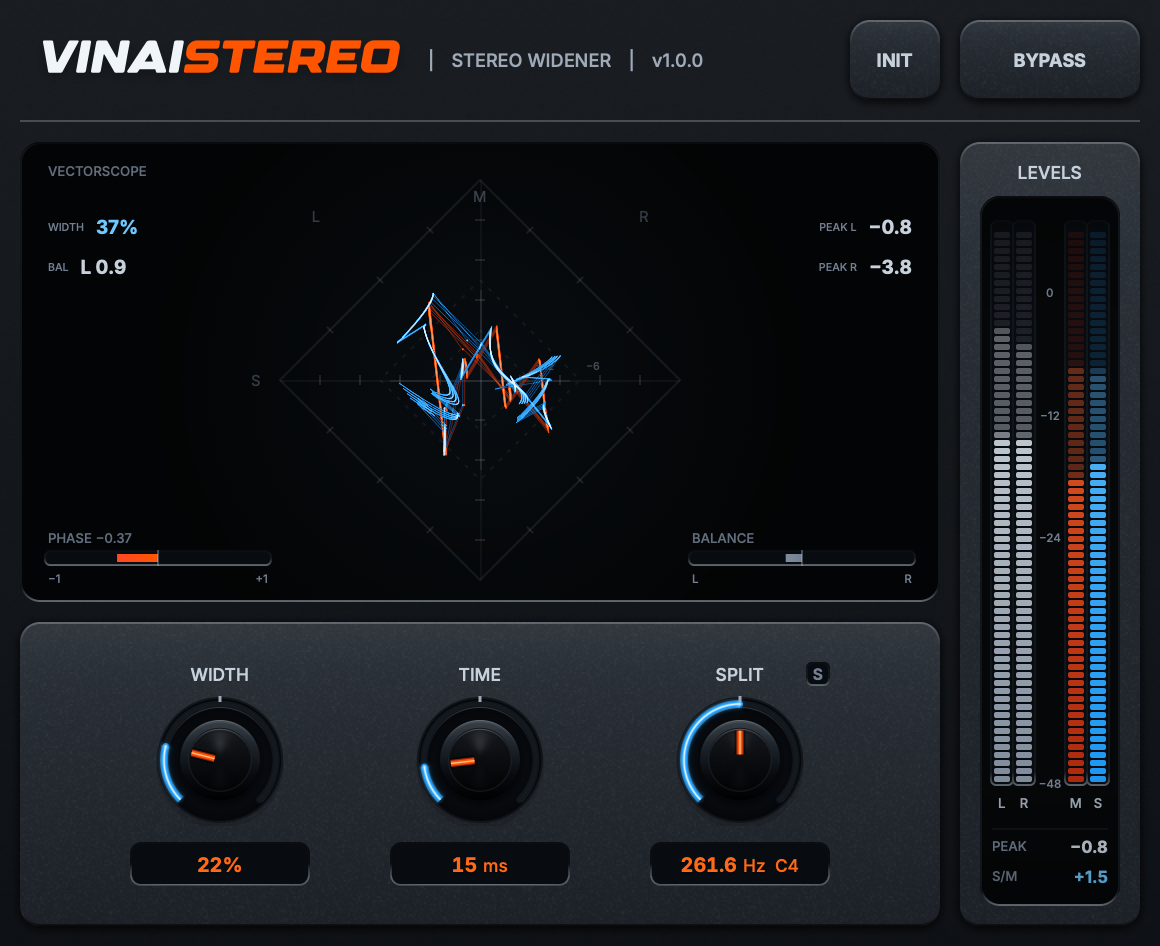
Widen with WIDE or HAAS, then watch the SIDE trace grow. The analyzer shows exactly what the widener adds.

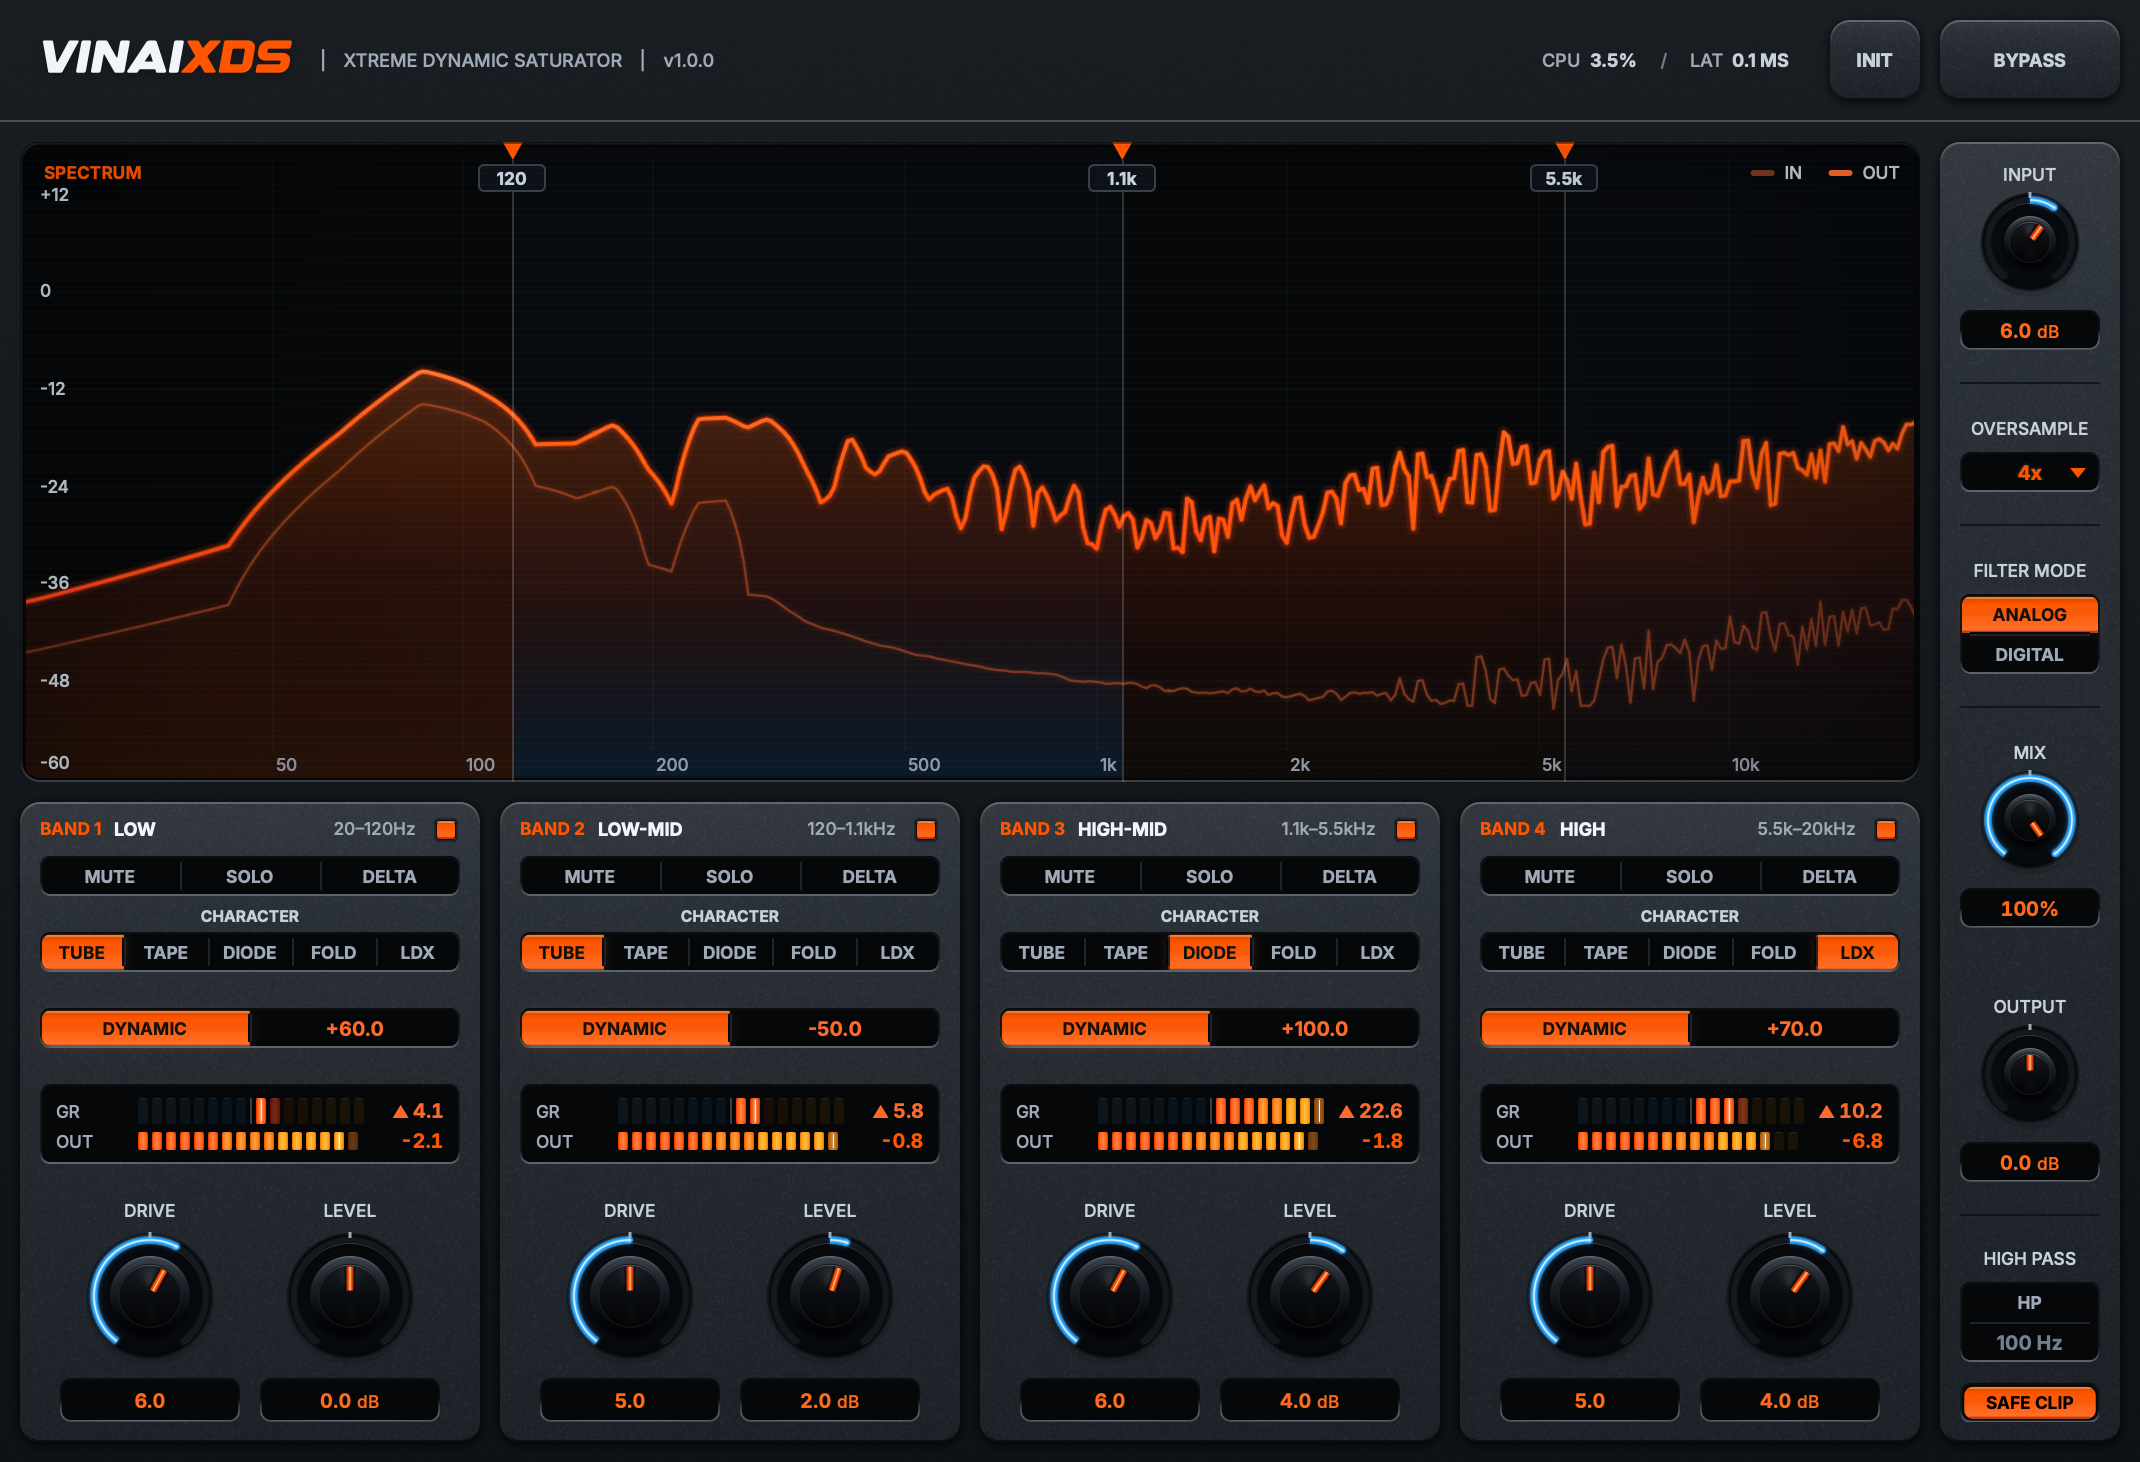
Shape four bands of saturation, then confirm every added harmonic on the M/S read.

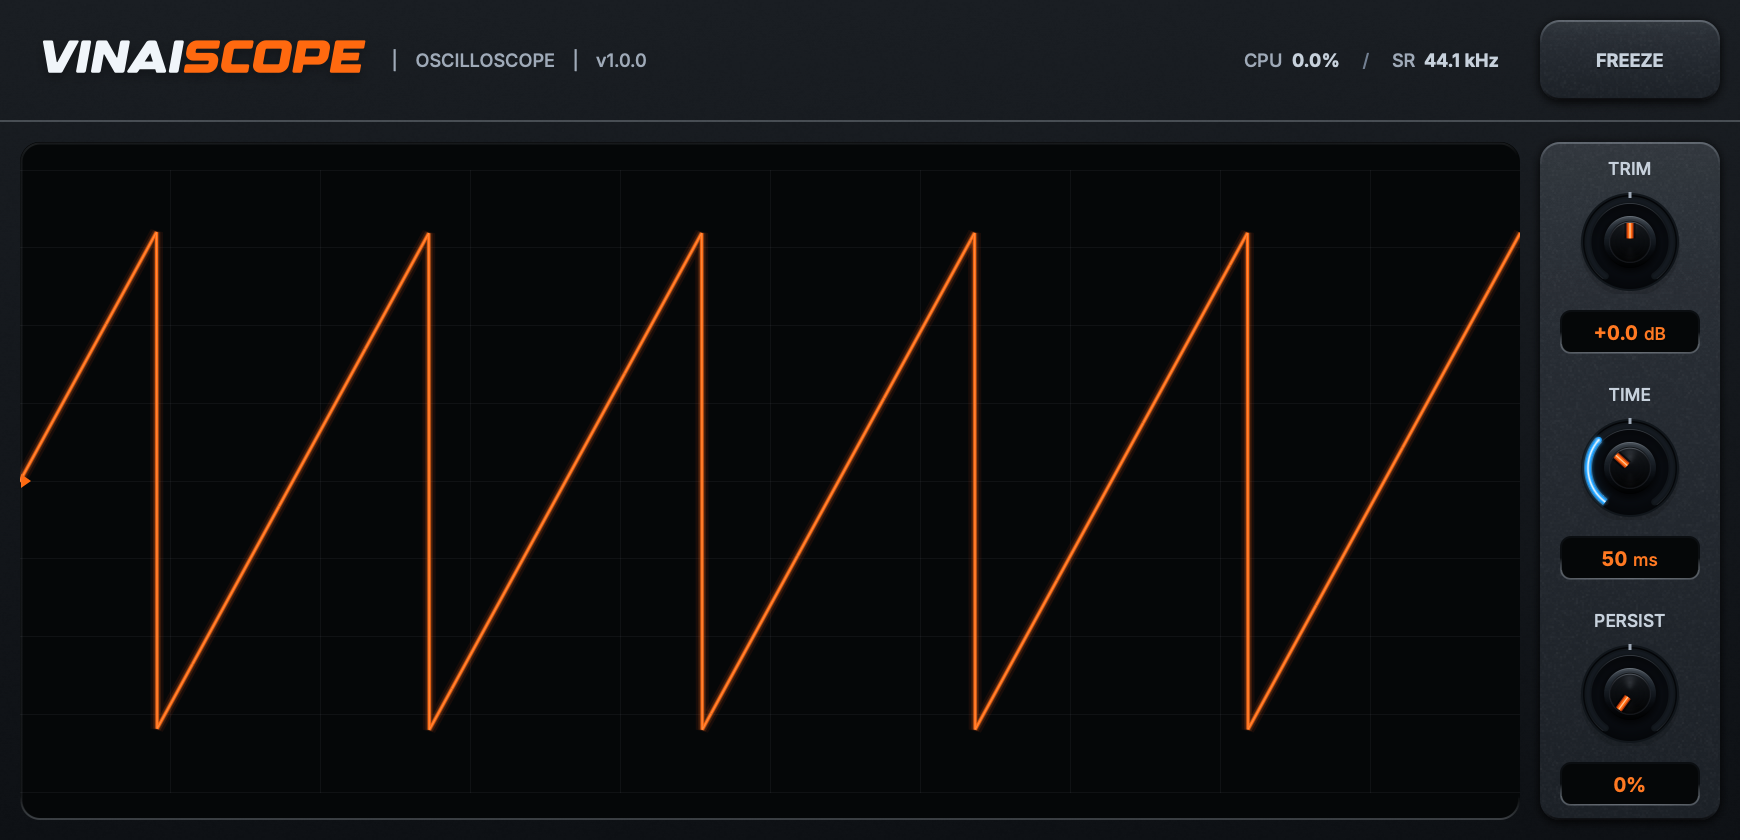
Time and frequency, side by side: the scope reads the waveform while spectro reads the spectrum.
VINAIspectro isn't sold separately. It ships only with the nine-instrument Suite, alongside every other VINAI tool.